Agriculture sits at the centre of multiple systemic challenges. Climate change, biodiversity decline, soil degradation, and tightening regulatory expectations are reshaping how and where food is produced. These pressures are compounded by financial strain in an already highly competitive and volatile market with thin margins, where farmers face growing reporting demands from buyers, lenders and insurers, seeking to mitigate their own risk exposure.
Yet while the need for better environmental intelligence across the food system is clear, the solution is not to require ever more reporting from farmers. A first step should always be to make better use of the substantial environmental and agricultural data that already exists.
The UK holds a wealth of open datasets related to agriculture. These include land ownership and field boundary data, crop maps, subsidy scheme information, soil classifications, emissions inventories, biodiversity datasets, hydrological data, and more. These datasets are valuable for a wide range of applications but remain fragmented. They are published by a variety of organisations, including Defra, the Rural Payments Agency, Natural England, the UK Centre for Ecology and Hydrology, and the National Atmospheric Emissions Inventory, among others, and use different identifiers, formats, and update cycles.
As a result, they are rarely connected in ways that allow stakeholders higher up the value chain to understand environmental risks and opportunities at the level of individual farming businesses or across portfolios. Connecting these datasets offers a pathway to more granular, actionable insight without increasing the reporting burden on farmers.
Building a farm-level production database
To demonstrate that this is possible, we developed a database linking agricultural land, farming entities across England and production estimates using readily available, spatially explicit datasets. The full methodology is outlined in detail in a recent research article, but in summary this process involved two core steps.
First, we linked agricultural land to farming entities by combining geospatial datasets from Ordnance Survey, the Land Registry, and Natural England. Where direct links were not available, spatial modelling techniques were used to associate fields with nearby farm locations.
Second, we estimated agricultural production for each field. Using the Rural Payments Agency’s Crop Map of England, national crop yield statistics, and spatial livestock data, we estimated crop output and grazing livestock numbers at both field and farm level. While this approach relies on national averages and proxy indicators, it provides a consistent baseline across the country.
The resulting database covers more than 117,000 farming entities and approximately 8.6 million hectares of agricultural land in England. Although subject to methodological limitations, it represents a first step towards open, asset-level agricultural data in the UK and provides a foundation for portfolio-scale environmental analyses.
Enabling spatially explicit assessments
Many environmental issues can be analysed using spatially explicit datasets, of which the UK produces a large number, many of which are openly available. By providing the spatial footprint of named farming entities, organisations can leverage these datasets to assess physical climate risk exposure, identify nature-related risks and opportunities, estimate greenhouse gas emissions, and more.
Monitoring exposure to physical risks
Precise location data enables assessment of exposure to climate hazards, both historic and projected. By overlaying farm locations with drought indicators such as the Standard Precipitation Index (SPI), flood risk maps, or coastal erosion projections, stakeholders can evaluate how different holdings experience climate variability.
For example, analysis of recent SPI data from the UK Centre for Ecology and Hydrology’s Water Resources Portal shows substantial variation in drought and extreme wetness exposure between the South West and East Anglia over the summer of 2025. As extreme weather events become more frequent, understanding geographic exposure supports more informed risk assessment, resilience strategies and adaptation planning across the food system.
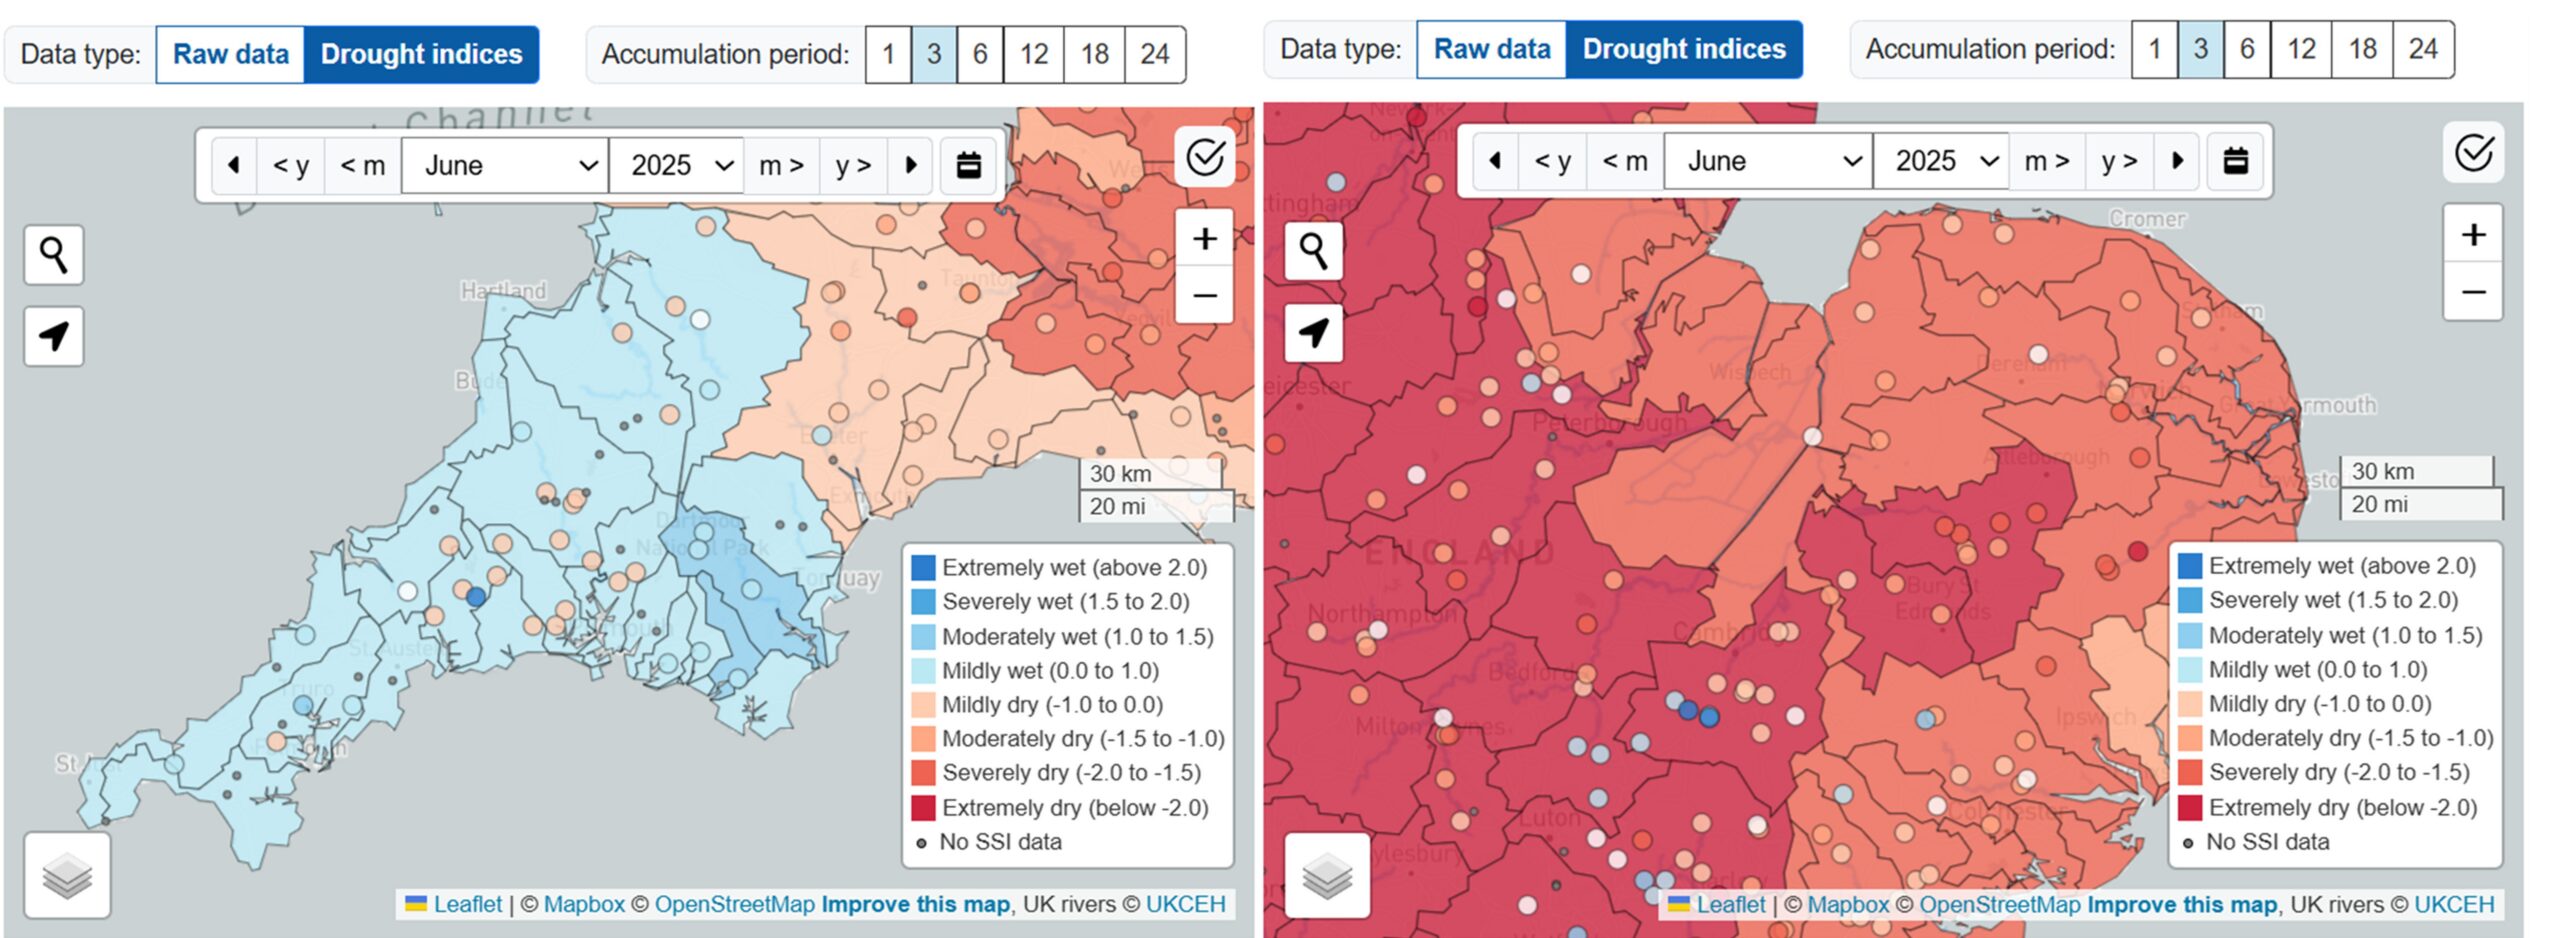
Example of two different drought profiles across England in June 2025. The first map shows mildly wet and mildly dry 3-month Standard Precipitation Index values for parts of the South West. The second map shows severely and extremely dry 3-month Standard Precipitation Index values for parts of East Anglia during the same period. Source: UK Water Resource Portal, UK Centre for Ecology and Hydrology
Assessing nature-related risks and opportunities
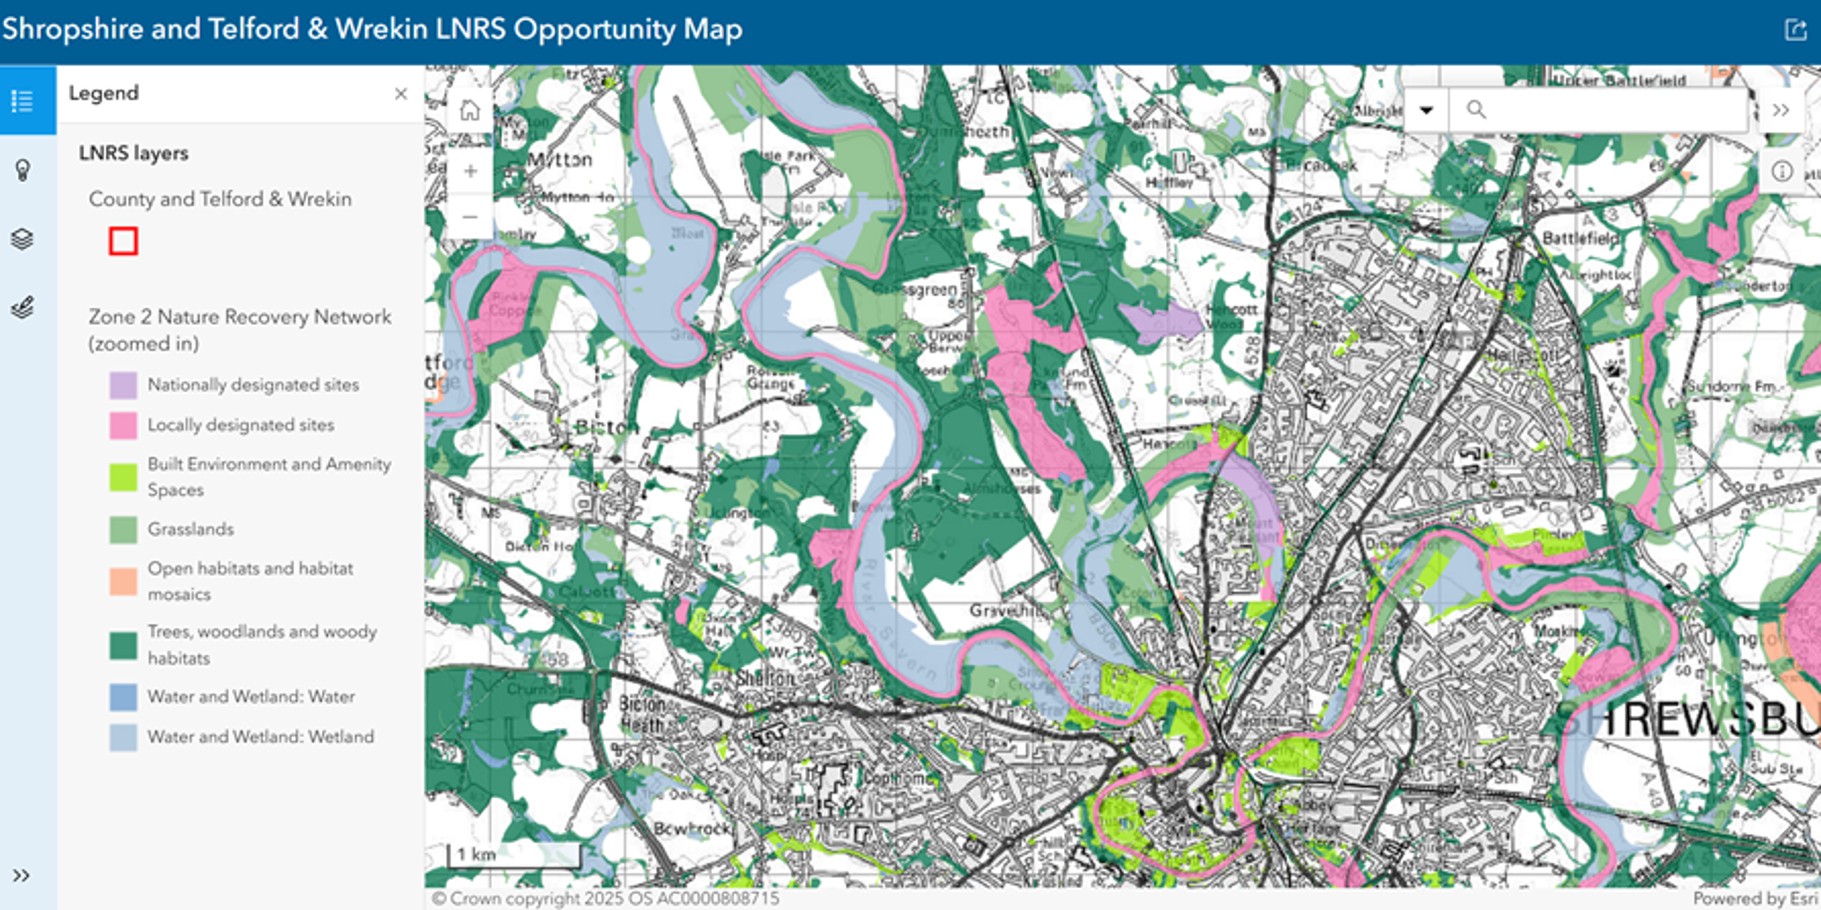
Agriculture is highly dependent on ecosystem services such as healthy soils, pollination, water regulation and biodiversity while also exerting significant pressure on natural systems. Location-specific data is therefore critical for identifying nature-related risks and opportunities. By combining farm-level information with biodiversity datasets such as protected area inventories, priority habitat maps and ecosystem condition indicators, it becomes possible to assess how farming operations might interact with sensitive ecological areas and processes.
Global screening tools such as the WWF Biodiversity Risk Filter are helpful for high level screening across multiple countries while national datasets often offer greater granularity, enabling more detailed analysis for domestic portfolios. Such approaches can help identify opportunities for nature restoration, agroforestry, wetland creation and other nature-based solutions, particularly where they align with emerging local nature recovery strategies.
Improving greenhouse gas emission estimates
Agricultural emissions vary significantly depending on crop type, livestock composition, and farming practices. Where direct reporting is unavailable, production-based estimates can provide a more granular alternative to revenue-based methods. By combining estimated production volumes with established emission factors, it is possible to derive indicative emissions at farm or portfolio scale. For example, emission factors from the UK National Inventory Document submitted to the UNFCCC, or lifecycle assessments from academic studies such as those available through the University of Oxford’s HESTIA platform, can be applied. While such estimates remain coarse and do not capture farm-specific practices, they improve consistency and transparency. Further refinement is possible through the integration of more detailed spatial emission or production datasets.
Limitations and future work
Developing this database of individual farms from publicly available UK datasets proved significantly more complex than anticipated. Key sources often lack alignment and shared identifiers, making it difficult to link entities reliably. Although detailed farm-level data is already collected by government bodies, much of it remains inaccessible beyond aggregated outputs. As a result, the current database remains constrained and is better suited to portfolio-level analysis than granular, farm-specific decision-making.
Looking ahead, improving access to and harmonisation of existing public datasets is essential to unlock more precise environmental insights. Building on models such as Open Banking and Open Energy, future efforts should focus on establishing interoperable data infrastructure to support more effective, data-driven environmental management. Creating a secure and trusted framework for sharing farm-level data, without increasing reporting burdens, could enable more coordinated action across the agricultural value chain. We hope this database contributes to that journey and serves as a foundation for others to update, build, and expand upon.
The England Agriculture Production Database is available to download here and was created as part of the agri-climate partnership between the Oxford Sustainable Finance Group and Barclays.